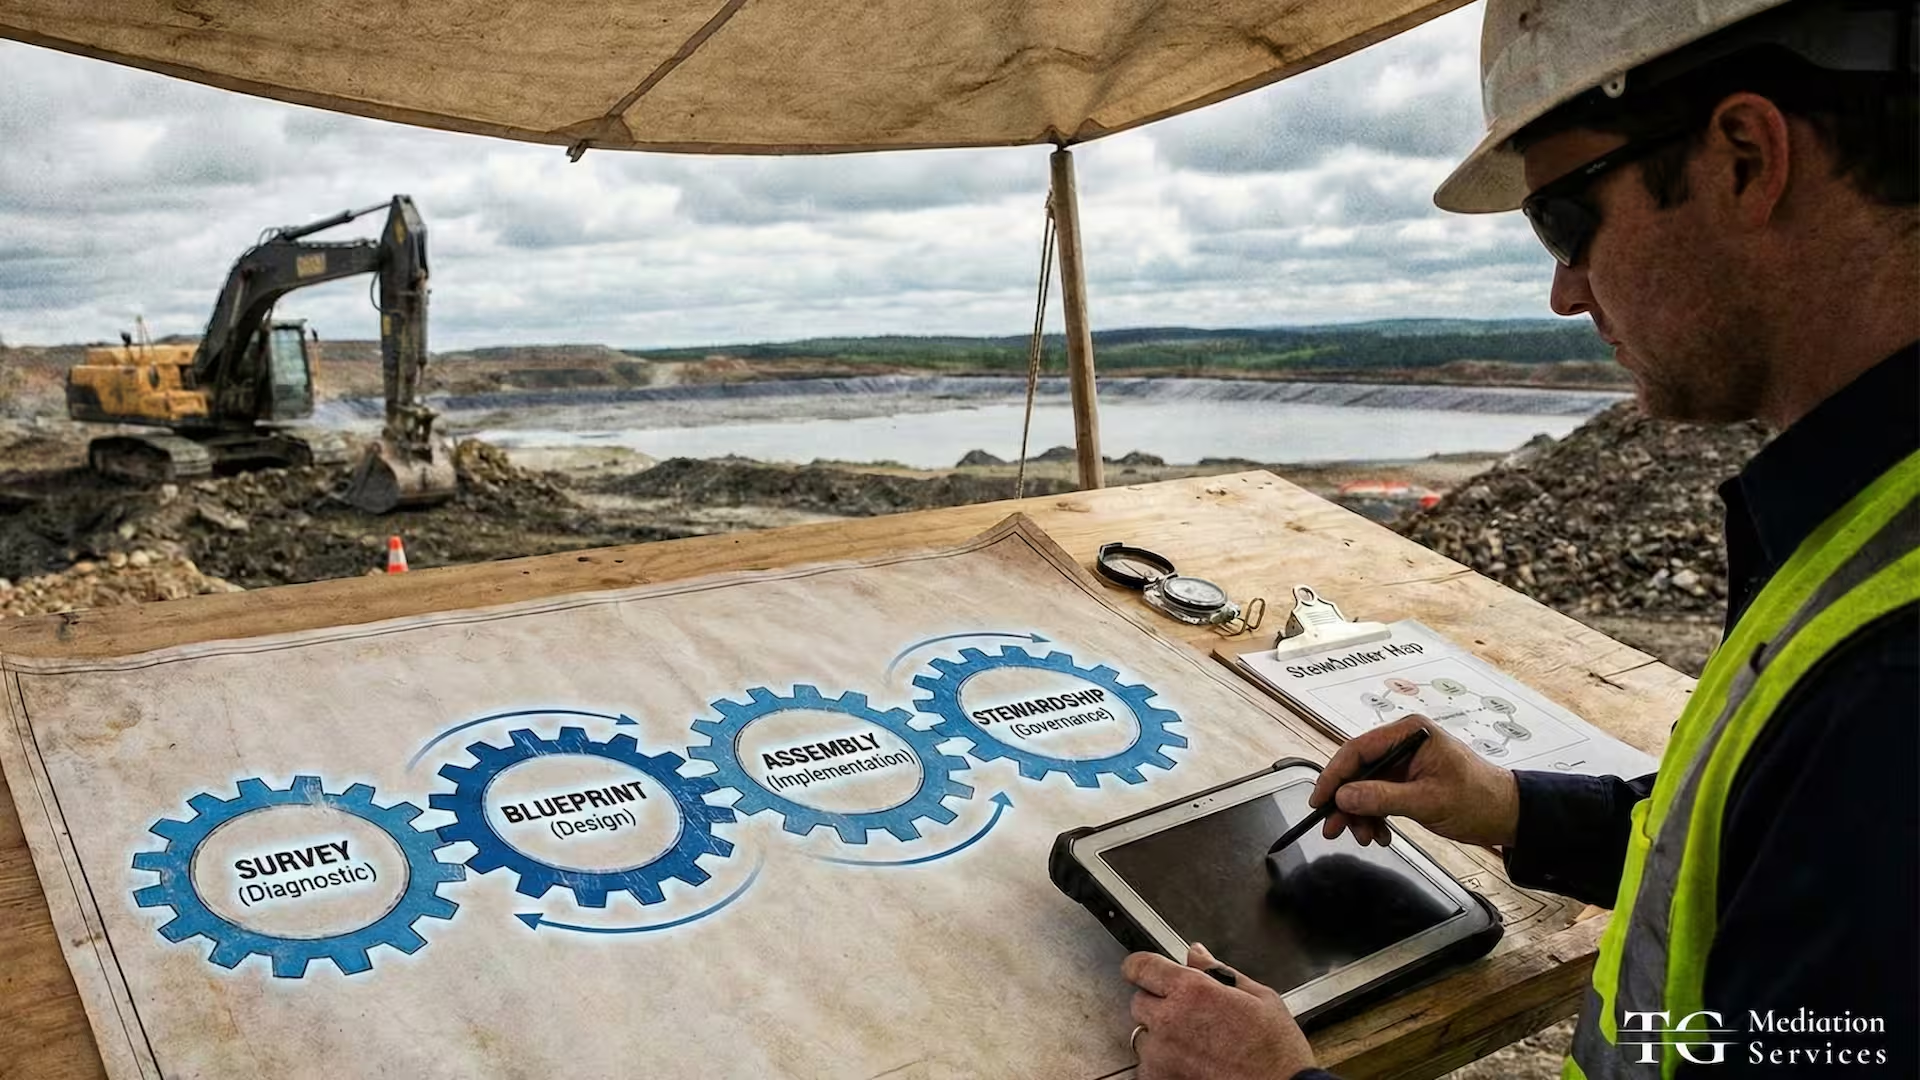
A four-pillar framework for measuring what actually predicts operational stability: community trust, commitment delivery, adaptive capacity, and local development outcomes.
Social performance indicators are metrics designed to measure the quality and durability of relationships between mining operations and affected communities. Unlike traditional CSR reporting that counts activities (meetings held, schools built, jobs created), genuine social performance indicators track what actually matters for long-term operational stability: whether communities trust the company, whether they feel their concerns are heard and addressed, whether the company is delivering on commitments, and whether the relationship will survive a crisis or operational challenge. For mining executives and ESG teams managing community relations across multiple sites, implementing a social performance indicator framework transforms social engagement from an unmeasured activity into a strategic management tool that predicts operational risk and identifies relationship problems before they escalate into conflict.
With GRI 14, the new Mining Sector Standard, taking effect in January 2026, and ICMM’s Social and Economic Reporting Framework now requiring members to report against standardized social indicators, the expectation for rigorous, outcome-based social performance measurement has shifted from best practice to baseline compliance. Companies that still rely on activity-based metrics will find themselves both operationally exposed and reporting-deficient.
Why Traditional CSR Metrics Fail to Measure Social Performance
Most mining companies track social performance using activity-based metrics. Annual reports highlight the number of community meetings held, the number of students in scholarship programs, the number of jobs created for local workers, the amount of money spent on community development projects. These metrics are measurable, they appear in sustainability reports, and they satisfy compliance checklists. They also bear almost no relationship to actual community relationship quality or operational risk.
An operation might conduct 100 community meetings per year and still face community opposition that halts production. A company might fund a thousand scholarships and still lack the social license to operate. A project might create 500 local jobs and still be surrounded by communities that actively oppose the company’s presence. Activity metrics tell you what you did. They do not tell you whether your engagement produced genuine consent, whether communities believe the company is trustworthy, or whether the relationship will hold under pressure.
The gap between activity and outcome emerges most clearly during operational crises. When environmental incidents, safety failures, or changes in project scope occur, the community’s response depends not on how many activities were conducted but on the underlying quality of the relationship. A community that trusts the company will ask questions and listen to explanations. A community that views the company as extractive and untrustworthy will use the incident as justification for escalated opposition.
The Three Dimensions of Social Performance
Genuine social performance indicators measure three distinct dimensions that traditional metrics ignore. First, relational performance: does the community believe the company listens, respects their concerns, and acts on their input? Second, transactional performance: is the company delivering on its commitments regarding employment, community benefits, environmental protection, and cultural respect? Third, adaptive performance: when circumstances change, does the relationship prove durable, or does it fracture under pressure?
Each dimension requires distinct metrics with distinct data collection methods. Relational performance is measured largely through qualitative research and perception surveys. Transactional performance relies on verifiable data about commitments versus outcomes. Adaptive performance is revealed through crisis response patterns and longitudinal tracking of community attitudes over time. A company might perform excellently on one dimension and fail badly on others. An operation might deliver jobs and community investment perfectly but fail on relational performance by treating community input as noise to be managed rather than signals to be addressed. This creates the appearance of success on traditional metrics while social license erodes rapidly.
The Core Social Performance Indicator Framework
Effective social performance tracking requires a structured set of indicators that measure across multiple dimensions and can be tracked consistently over time. The framework below is adapted from ICMM guidance on social progress indicators and refined through application in African mining contexts where relationship dynamics are complex and historical trust is often limited.
Pillar 1: Community Perception and Trust
- Community Trust Index: Annual perception survey asking community members whether they believe the company will fulfill its commitments, whether they trust company leadership to be honest, and whether they feel the company respects their rights. Measured on a quantified scale (0 to 10 or Likert scale). Target benchmark: 70% of surveyed community members rating trust at 7 or higher. Tracked separately for community segments (landholders, local business owners, non-affected residents) to identify pockets of opposition.
- Community Voice and Influence: Quarterly tracking of the number of community-raised concerns addressed by the company, the average time from concern submission to company response, and community satisfaction with how concerns were handled. This metric directly addresses the perception gap. A company might hold 50 community meetings per year, but if community input is never acted upon, those meetings damage rather than build trust. The metric measures whether communities experience themselves as heard.
- Cultural Respect and Inclusion Indicators: Measurement of community perception that their cultural practices are respected, that sacred sites are protected, and that community knowledge systems are valued rather than dismissed. In African mining contexts, this includes specific questions about whether women and youth are included in engagement processes, whether elder leadership is acknowledged, and whether decision-making timelines respect community cultural practices. GRI 14 now requires tracking this separately for Indigenous communities, but the principle applies to all affected populations.
Pillar 2: Commitment Fulfillment and Transactional Performance
- Community Benefit Delivery Rate: Percentage of committed community benefits (employment targets, education initiatives, infrastructure projects, revenue-sharing) delivered on schedule and at committed quality levels. This is the most straightforward metric, but implementation often stumbles on what counts as ‘delivered.’ A school built by the company but poorly maintained and under-resourced technically meets the commitment but represents failed transactional performance. Better practice includes tracking both completion and the community’s assessment of utility.
- Local Employment Pathway Tracking: Rather than counting the number of local employees, track the percentage of local workers in different job categories, the average tenure of local workers, advancement rates from entry-level to skilled positions, and wage comparisons between local and migrant workers. This framework reveals whether local employment represents genuine opportunity or job segregation. In West African mining contexts, this disaggregation frequently reveals that ‘local employment’ masks significant quality gaps.
- Grievance Resolution Effectiveness: Track the total number of community grievances, the average time to resolution, the percentage of grievances resolved to community satisfaction, and the percentage of grievances that escalate despite resolution attempts (indicating the resolution was unsatisfactory). This metric must distinguish between grievances formally lodged through company channels and community concerns that never reach formal systems because communities do not believe the company will address them fairly.
Pillar 3: Adaptive Capacity and Crisis Response
- Relationship Resilience Under Stress: Tracked through community sentiment and opposition patterns during operational challenges. Measure whether communities maintain dialogue with company leadership during environmental incidents, safety crises, or project changes, or whether they shift to external escalation (media campaigns, protests, legal action). In Tanzania, a mine tracked community communication frequency during a water quality incident and found that communities with higher baseline trust scores were significantly more likely to raise concerns directly rather than escalating through external actors.
- Stakeholder Alignment Index: Quarterly measurement of alignment between company and community on key operational issues. Specifically, track whether key stakeholder groups (community leadership, women’s groups, youth, business owners) share similar understanding of project scope, timeline, and impact expectations. Misalignment on these fundamental issues predicts conflict. In an East African copper expansion, early tracking of stakeholder alignment revealed that only 35% of community leaders had accurate understanding of what areas would be affected by the expanded footprint. Targeted re-communication was conducted before misunderstanding escalated.
Pillar 4: Community Benefits and Local Development
- Economic Opportunity Disparity Ratio: Calculate the ratio of economic benefits (jobs, procurement, local business partnerships) to total community population. Better yet, track the distribution across different community segments. A benefit stream heavily concentrated among a narrow segment creates resentment among excluded groups. Track disaggregated data by gender, age, and proximity to mine site.
- Procurement Localization Rate: Percentage of company procurement from local suppliers, broken down by category (capital equipment, consumables, services). Beyond percentage, track whether local suppliers are supported with training, payment term negotiation, and contract sustainability. Many mining operations source locally only for low-value categories while reserving high-margin contracts for external suppliers. This procurement approach damages rather than benefits local economies.
Practitioner Insight: The Indicator Selection Problem
Mining operations frequently measure what is easy to track rather than what matters for relationship quality. Meeting attendance is easy to measure. Whether attendees believe the meeting addressed their concerns is harder. Jobs created is trackable through payroll. Perceived fairness of hiring processes is qualitative.
The framework above mixes quantitative metrics (Trust Index, Grievance Resolution Time) with qualitative measures (perception surveys, stakeholder alignment assessment). Both are essential. Companies that rely exclusively on quantitative metrics often maintain healthy-looking scorecards while relationship quality deteriorates beneath them.
Data Collection Methods That Generate Trustworthy Results
A social performance indicator framework is only as valuable as the data quality that supports it. In African mining contexts where historical relationships between companies and communities are often marked by broken promises and unequal power dynamics, community members are skeptical of company-conducted research. Data collection methods must address this credibility gap or results will be systematically biased toward positive findings.
Community Perception Surveys: Design and Execution
Annual community perception surveys are the backbone of relational performance tracking. But survey design determines result validity. Company-designed surveys asking loaded questions (“Do you appreciate the company’s community investment?”) will generate positive responses that reflect social desirability bias rather than genuine sentiment. Better practice requires that surveys be designed in partnership with external research organizations and validated through focus group testing with community members before deployment.
Survey sample design must ensure representation across community segments. Surveying 400 people in a community of 10,000 can be methodologically sound if the sample is properly stratified by geography, gender, age, and relationship to the mining operation. But surveying only those who attend company events systematically excludes the most skeptical community members. In Zambian copper operations, company-controlled surveys consistently showed 80%+ satisfaction with community engagement. Independent surveys of the same communities showed 40% satisfaction, primarily because the independent researchers accessed community members who never participated in company events. This is a critical lesson for anyone designing their engagement strategy.
Survey administration must build in anonymity and security. In many African contexts, community members fear that speaking negatively about the company could affect their employment prospects or their ability to receive community benefits. Independent administration, with clear assurances of anonymity and with data analysis conducted by external parties without company involvement, generates trustworthy results.
Grievance Tracking and Community Concern Analysis
Many mining operations formally track grievances submitted through company channels but fail to track community concerns that never reach formal systems because communities do not believe the company will address them. To capture the full picture of community dissatisfaction, parallel tracking is necessary. This includes periodic interviews with community leaders asking whether concerns exist that are not being raised formally, anonymous suggestion boxes in community spaces, and monitoring of community social media and local media coverage for mentions of company-related concerns.
Grievance tracking data should be disaggregated to reveal patterns. A tracking system might show 200 grievances received annually, but the data becomes actionable when you see that 80% come from one community segment, that average resolution time for environmental concerns is 6 months while employment concerns are resolved in 2 weeks, or that grievances from female-headed households are significantly less likely to be resolved. This pattern analysis reveals whether the company’s grievance system is genuinely accessible or functions as a mechanism to contain concerns from certain segments while attending more closely to others.
Qualitative Research: Focus Groups and Community Dialogues
Quantitative metrics show that a company scored 7.2 out of 10 on the Community Trust Index. Qualitative research explains why. Focus groups conducted with community members, asking open-ended questions about their experience with the company, their concerns, their understanding of the operation, and their hopes for the future, reveal the reasoning beneath survey scores. In West African mining contexts, qualitative research frequently reveals that communities’ low trust scores stem not from failures to deliver specific projects but from belief that they are not included in decisions affecting their lives.
Qualitative research must be conducted by researchers with no affiliation to the mining company. Community members will present very different narratives to a company researcher than to an independent researcher. The difference itself is meaningful information, indicating that community members do not feel safe speaking candidly to company representatives. But capturing genuine concerns requires genuine independence.
Operational Data Integration
Employment records, community benefit databases, and grievance logs are internal company data that feed directly into social performance metrics. But for this data to support genuine relationship assessment, it must be collected and analyzed in ways that prevent biased interpretation. Specific recommendations include establishing independent oversight of data quality (either through board-level committee or external audit), disaggregating data by community segment before analysis to prevent hidden disparities, comparing company records to independent verification (asking community members whether they received promised benefits), and maintaining longitudinal data to identify trends rather than judging performance on single-period snapshots.
Reporting Frameworks and Governance Structures
Social performance indicators are useful only if they are tracked consistently, reported transparently, and acted upon when they reveal problems. The governance structure that supports indicator tracking must ensure that data does not simply accumulate in company databases but actually influences decisions about community engagement strategy.
Quarterly Social Performance Reviews
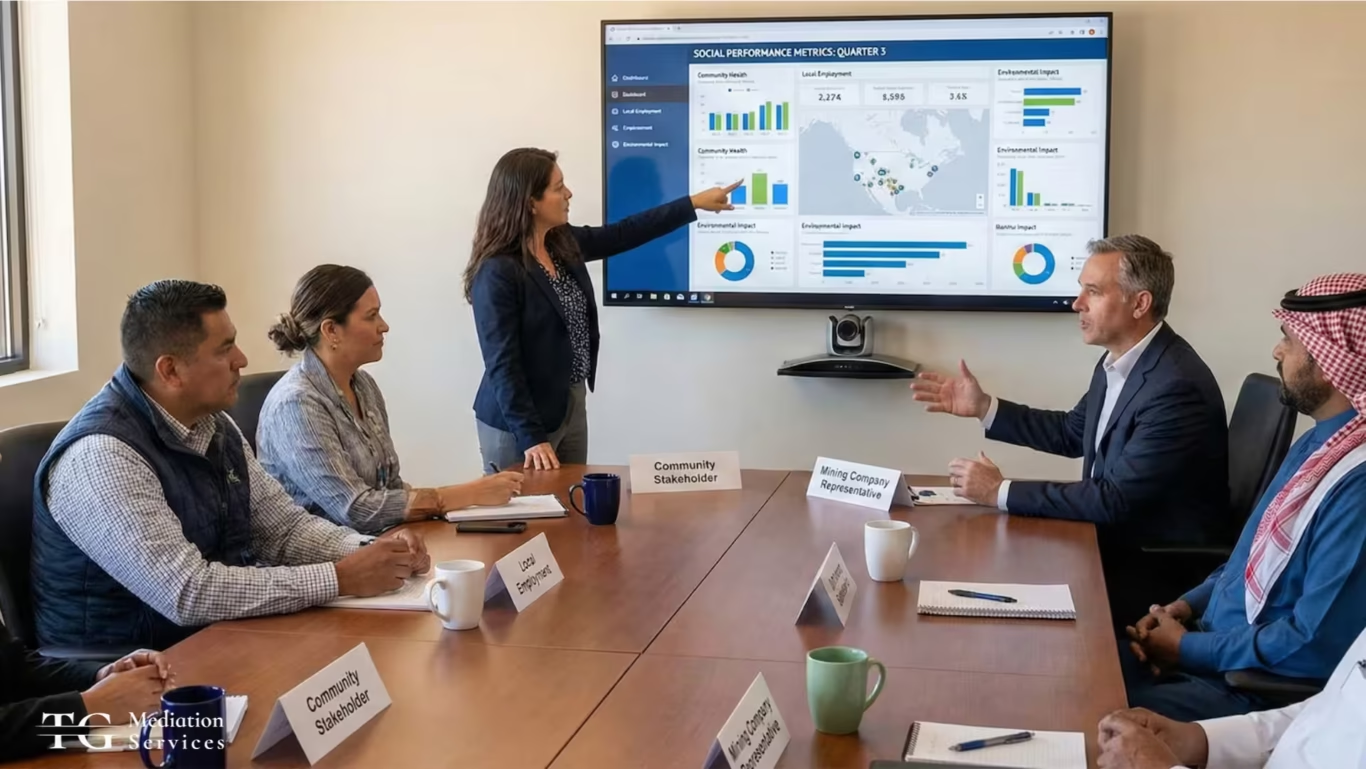
Leading mining operations conduct quarterly reviews of social performance metrics with attendance from site leadership, community relations managers, and representatives from external stakeholder groups (community leaders, environmental monitors, civil society organizations where they exist). The review examines trends in key indicators, investigates sudden changes, discusses community concerns that have emerged, and proposes modifications to engagement strategy based on metric findings.
These reviews are most effective when supported by dashboards that display indicator trends visually and highlight areas of deterioration or concern. When a Community Trust Index drops from 7.5 to 6.8 between quarters, this visual representation of decline prompts investigation into what changed. Did a specific incident damage trust? Has community perception of commitment fulfillment declined? Has a particular community segment shifted to opposition? Identifying the driver of decline allows targeted response rather than generic relationship-building efforts.
External Reporting and Transparency
Social performance indicators are increasingly embedded in sustainability reporting frameworks required by lenders and ESG rating agencies. GRI 14, the new Mining Sector Standard effective January 2026, requires comprehensive disclosure on community engagement quality, land and resource rights, and local development outcomes. The Equator Principles, adopted by major development finance institutions, require social performance monitoring. Rather than resisting these requirements, leading mining operations treat them as drivers for improving internal social performance management.
Best practice transparency requires reporting not just positive metrics but honestly addressing areas where performance fell short. A company reporting that Community Trust Index is 6.8 out of 10 (below target) and explaining the drivers of decline generates far more credibility than reporting only favorable metrics. It demonstrates that the company is genuinely using social performance data to drive improvement rather than simply generating favorable narratives.
Internal and external reporting should be consistent. When community members see different metrics in community reports versus corporate sustainability reports, this damages trust far more than unfavorable metrics would. Transparency about performance, positive and negative, builds credibility. Consistency between internal and external reporting demonstrates that the company is not presenting a sanitized external version while managing real community issues internally.
Case Scenario: Implementing Social Performance Indicators in a Gold Operation
Try to picture a gold mining operation that is approaching the fifth year of production with a sustainability report showing strong community performance metrics. The operation reported that it had met 95% of committed community benefits, that local employment had grown to 450 people (35% of the workforce), and that it conducted 60 community meetings annually across its area of influence.
But community relationships were deteriorating. A civil society organization conducting independent research found that community trust in the company was declining, that communities felt excluded from decisions about the operation’s evolution, and that opposition groups were gaining influence. The company’s traditional metrics revealed none of this.
The operation engaged an external firm to implement a comprehensive social performance indicator framework. The first year of measurement revealed significant gaps. The Community Trust Index was 5.8 out of 10, substantially below company expectations. When disaggregated by community segment, the variation was stark. Communities living directly adjacent to the mine site reported trust of 4.2. Communities in secondary villages reported 6.5. This disaggregation revealed that proximity to operational impacts was the primary driver of trust decline.
Community Voice and Influence tracking showed that while 60 meetings were held annually, the company responded to only 18% of community-raised concerns. Many concerns were not addressed because they related to project decisions that company leadership viewed as non-negotiable. This created a dynamic where communities believed the company was not listening, even when the company was technically responsive. The metric revealed that responsiveness required not just answering concerns but genuinely considering them in decision-making.
Grievance analysis revealed that environmental concerns submitted by communities took 8 months to resolve on average, while employment concerns were resolved in 2 weeks. This disparity reflected the company’s organizational structure, where environmental issues involved multiple government agencies and external permits, but it created community perception that the company treated environmental concerns as less important than employment matters.
The operation’s response included establishing quarterly stakeholder advisory committees with voting power over certain community benefit decisions, implementing a dedicated environmental community monitoring program where community members received training to conduct independent environmental monitoring alongside company-contracted monitors, and restructuring the grievance process to separate environmental concerns into a specialized pathway with dedicated resources and target resolution timelines of 12 weeks maximum.
After 18 months of implementing these changes, the Community Trust Index increased to 6.9. Trust levels for the most affected communities increased to 5.8. These improvements corresponded to measurable changes in operational relationships. Protests declined. Grievances shifted toward constructive engagement rather than escalation. The operation entered a major expansion phase with substantially less community opposition than had been anticipated.
The social performance indicator framework allowed the company to see a problem that traditional metrics had obscured, measure the problem’s dimensions with sufficient precision to allow targeted intervention, and track whether interventions produced real improvement. This is the core value of moving beyond activity-based metrics to performance-based measurement.
Ready to Implement Social Performance Indicators?
If your operation is managing community relationships across multiple sites and needs to move beyond activity counting to genuine relationship measurement, our Social Performance Framework Development service provides customized indicator design, data collection methodology, quarterly review governance, and coaching for site teams implementing the framework.
Schedule a consultation to assess your current social performance measurement and develop a framework suited to your operational context.
Download: Social Performance Indicator Tracking Template
If you are ready to move beyond activity-based metrics and implement genuine social performance measurement, the Social Performance Indicator Tracking Template and Governance Framework provides everything you need to get started. The template includes a comprehensive spreadsheet for tracking the four indicator pillars, data collection protocols for community perception surveys and grievance analysis, a quarterly dashboard structure, and governance guidelines for embedding social performance reviews into operational decision-making. It also includes sample survey instruments and reporting templates adapted for mining operations.
Sources
- ICMM (2022, updated 2025). “Social and Economic Reporting Framework” and “Mining Contribution Index, 7th Edition.” International Council on Mining and Metals. Commits member companies to report against standardized social and economic indicators. The 2025 MCI provides country-level analysis of mining’s contribution, emphasizing governance quality as a determinant of whether mining benefits communities. icmm.com
- GRI (2024). “GRI 14: Mining Sector Standard.” Global Reporting Initiative. The first global transparency standard for responsible mining, effective January 1, 2026. Requires comprehensive disclosure on community engagement quality, land and resource rights, human rights including Indigenous Peoples’ rights, and local economic development outcomes. globalreporting.org
- IPIECA (2015). “Social Performance Indicators for Oil and Gas.” International Petroleum Industry Environmental Conservation Association. Provides a foundational framework for defining and measuring social performance across extractive operations, with emphasis on stakeholder engagement quality, relationship durability, and community benefit delivery verification. While developed for oil and gas, the indicator categories apply directly to mining operations. ipieca.org